
The June Statistical Report from the Outer Banks Association of Realtors is out. Home prices remain strong. But is the market cooling just a bit? The report, released on July 7th, does state “the market is starting to cool – at least for the summer.” I’ll tell you where I see it in their report, and elsewhere. So let’s dig in.
The Stats
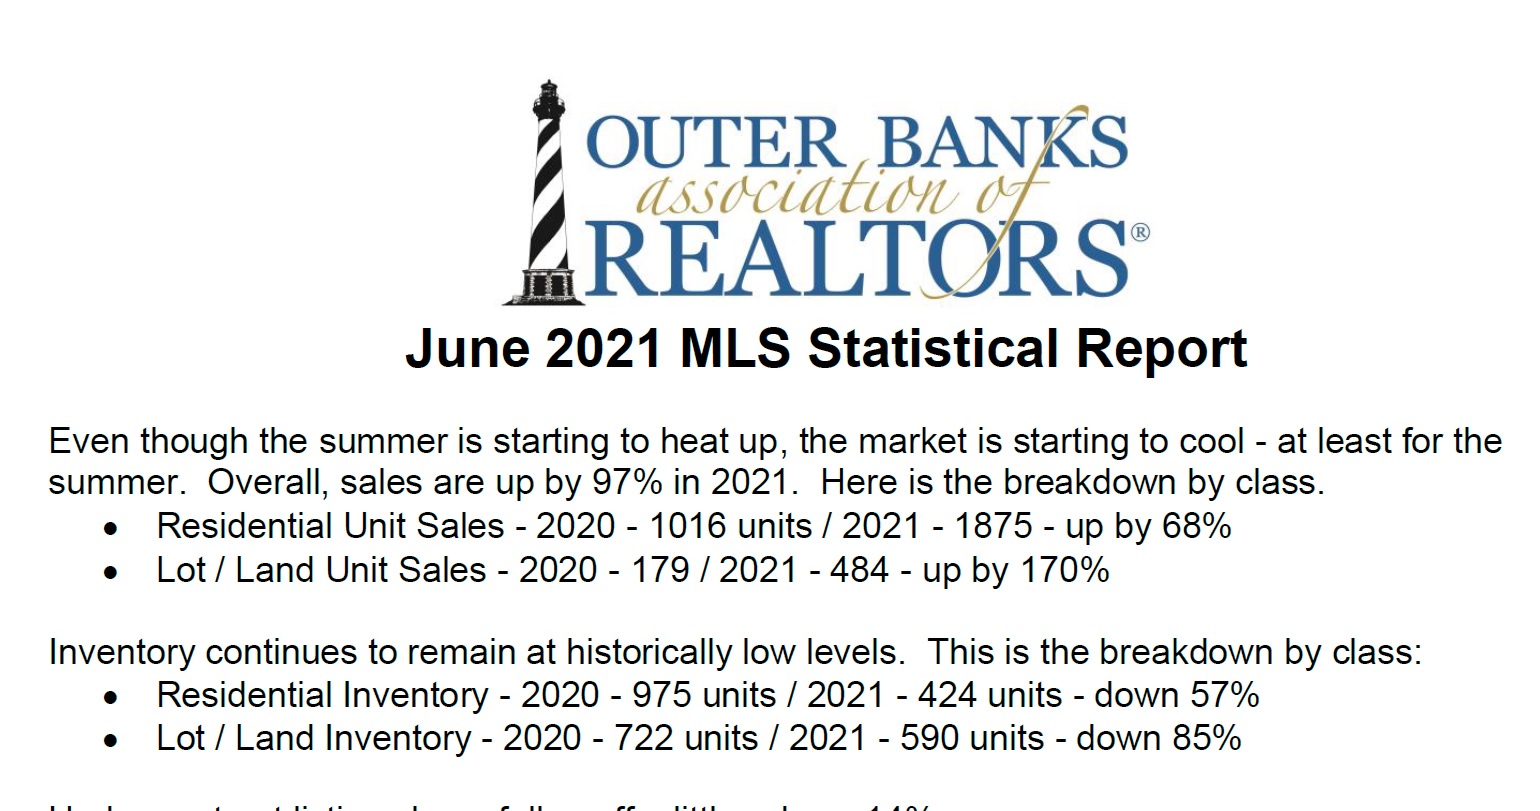
Year-to-date sales are up 97% over 2020. Residential unit sales are up 68%; 1016 units in 2020,1875 in 2021. Lot/Land unit sales are up 170%; 179 units in 2020, 484 units in 2021.
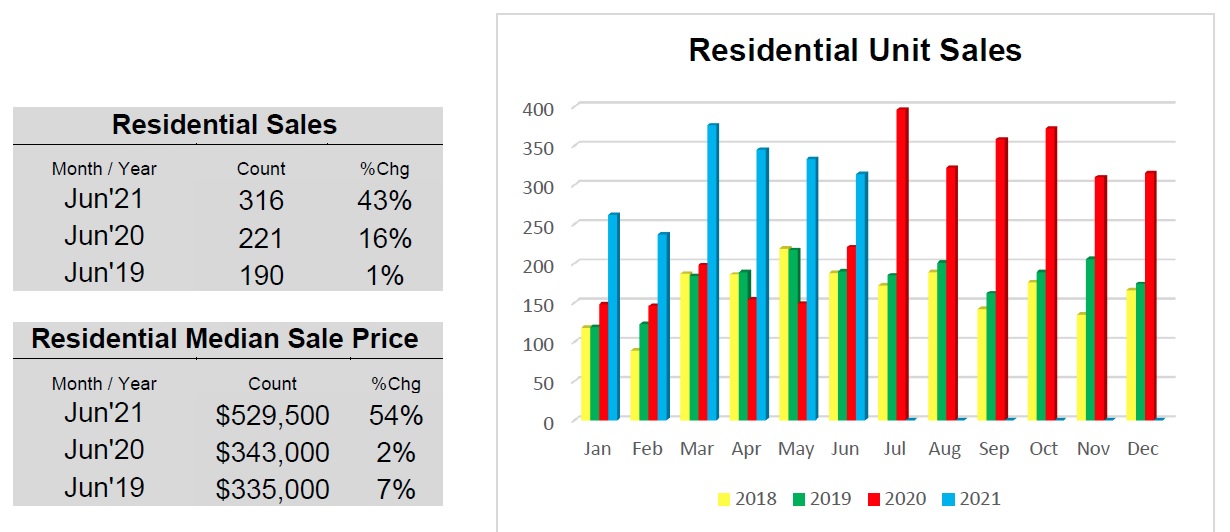
Residential monthly sales for June are up 43%, residential median price up 54% to 529,500, compared to 343,000 last June. Lot/Land sales are up 270%, 100 units compared to 27 last year. The median price is steady at $95,000.
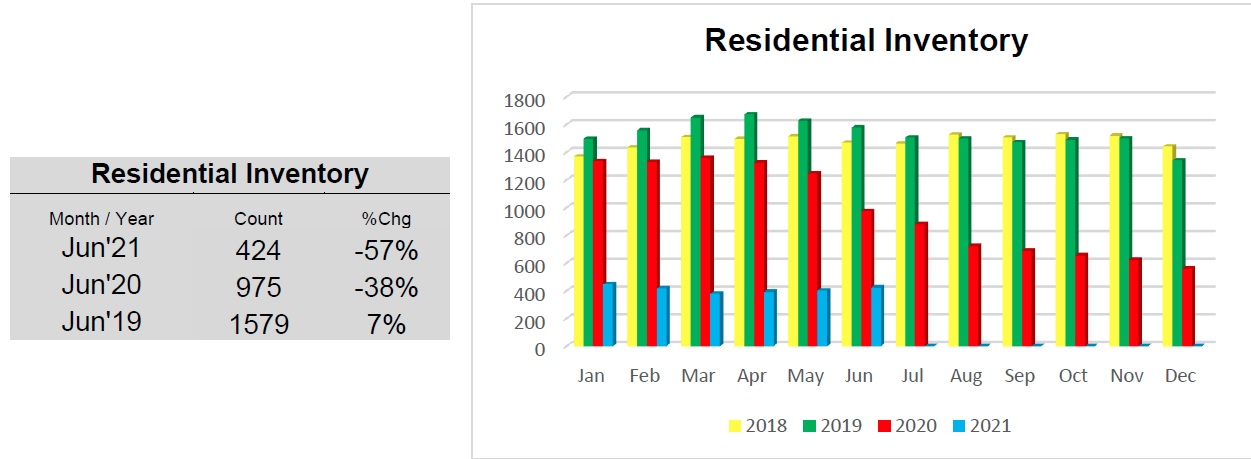
One reason lot/land sales are up so dramatically could be the low residential inventory forcing people to consider building in order to get the home they want. Residential inventory is down 57% compared to last year, but down 73% when compared to 2019. 424 units today compared to 1579 in 2019. Lot/Land inventory is down 18%.
Is the market cooling?
So OBAR says “the market is starting to cool”. What could they mean by that? The number of homes under contract, while still high, is down 14% compared to last June, and down 27% compared to the 2021 high of 923 in April. This indicates the market has slowed enough for attorneys, home inspectors, surveyors, and others to catch up a bit on the backlog of properties under contract and get them to closing.
Also, look at the graph of the monthly residential unit sales, shown above, and you can see the downward trend. So why is it cooling?
There are likely several factors behind the cool down. There was that pent-up demand that fueled the first wave of buyers. Then, prices started to rise and buyers, understandably, are now taking a little more time to look around. Also, the lack of inventory is a huge factor. With fewer homes to consider buyers are being forced to wait until the right home hits the market. The mindset of the buyer today could be much different when compared to that of buyers earlier this year, and most of last year.
I did an analysis to track the speed of the market. To see how many homes were going under contract in week 1, then week 2, etc. The year-to-date average for homes going under contract on days 0 through 6 is 43%, which is an extremely strong number. Looking at the weekly stats, with the exception of the first full week of January and the week of Easter, every other week is at, or above, the year-to-date average. That is until you get to the week ending May 16th. Each of those weeks is below that average.
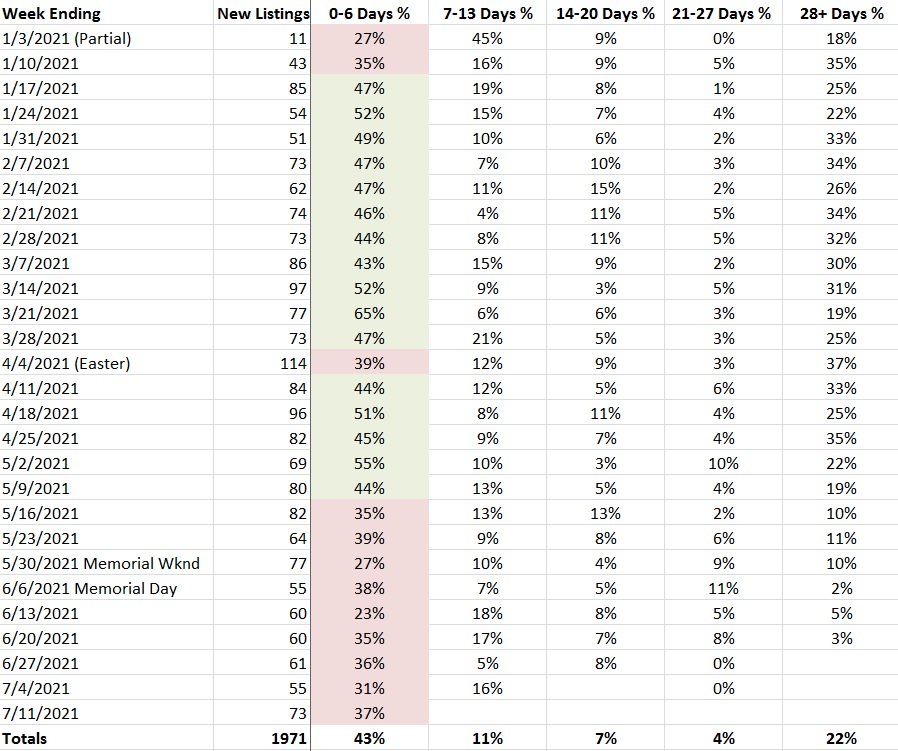
So that is another sign of the market cooling a bit. But, those are still strong numbers. The market may not be moving as fast as before, but 37% of new listings going under contract in the first 7 days, for the week ending July 11th, is still very fast. Compare it to the week ending July 14th, 2019 when that number was 2. Not 2 percent, 2 homes!
Still A Sellers Market
Buyers still need to put themselves in a position to move quickly when that perfect home hits the market. Get the pre-qualification letter, or better yet a pre-approval letter, from your lender. Get proof of funds if you are a cash buyer. Try to use as few contingencies as possible. However, do protect yourself as much as possible. We’ll talk about this as a part of the buying process.
Sellers still need to price the property correctly. Even in this hot seller’s market, I have seen instances where a home has been priced too high and has sat on the market for weeks, even months, instead of days. This isn’t about getting a quick sale. You absolutely need to get the top dollar for your home. But if the market is moving fast and your house isn’t, then there is a problem. We can work together to determine the correct price and proper strategy to get your home sold at top dollar in a reasonable amount of time.
I have helped both sellers and buyers achieve their real estate goals. Get in touch with me and let’s get to work! All of my information is at mooseobx.com.
Individual Area Stats – June 2021
Now to the stats for the individual areas for the month of June:
- Corolla sales up 32%, median sales price up 28% to $719,500.
- Duck sales down 27%, median sales price down 9% to $472,000. But much like last month, the figures in the OBAR report included 5 co-ownerships, where the use of 5 weeks or more of a property is sold, not the property itself. Without the co-ownerships included sales were flat, 14 units both years, the median sales price was up 30% to $904,500.
- Southern Shores Sales were up 86%, median sales price up 23% to $626,000.
- Kitty Hawk sales down 15%, median sales price up 22% to $482,500.
- Colington sales up 100%, median sales price up 14% to $340,000.
- Kill Devil Hills sales up 52%, median sales price up 18% to $389,000.
- Nags Head sales up 153%, median sales price up 26% to $605,000.
- All Hatteras sales up 145%, median sales price up 35% to $505,000.
- Roanoke Island sales down 18%, median sales price up 17% to $417,000.
- Currituck Mainland sales up 19%, median sales price up 14% to $315,050.
- Ocracoke sales up 600% – 7 units vs. 1 last year, median sales price up 13% to $402,500.
Information in this article/video is based on information from the Outer Banks Association of REALTORS® MLS for the period January 1, 2019, through July 15th, 2021.