Outer Banks Real Estate Market Weekly Update – Week Ending 2/6/2022
For the week ending 2/6 the numbers are very similar to the previous week. The percentage of homes going under contract within the first seven days is still above average. In case you didn’t see the February monthly update, last year’s average was 41%, 19% for 2020, 11% for 2019. Think about that! In 2019 only 11% of homes were under contract during the first 7 days. Now it is nearly half in some weeks.
| Units Sold | 51 |
| Average List Price | $726,484 |
| Average Sold Price | $721,036 |
| Median List Price | $550,000 |
| Median Sold Price | $550,000 |
| Average Days On Market | 35 |
| Median Days On Market | 12 |
| Total Volume | $36,772,851 |
| Units Under Contract | 64 |
| Average List Price | $828,078 |
| Median List Price | $589,500 |
| Average Days On Market | 39 |
| Median Days On Market | 12 |
| New Listings | 67 |
| Average List Price | $771,349 |
| Median List Price | $619,000 |
| New Listings Under Contract/Sold/Withdrawn | 35 |
| New Listings UC/Sold/Withdrawn % | 52% |
| New Listings UC/Sold/Withdraw 1st 7 Days | 32 |
| New Listings UC/Sold/Withdraw % 1st 7 Days | 48% |
| Active Listings As Of 2/17/2022 | 268 |
| Average List Price | $921,345 |
| Median List Price | $622,500 |
Information in this article is based on information from the Outer Banks Association of REALTORS® MLS for the period January 23rd, 2022, through February 7th, 2022. Residential, not including co-ownerships.
Moose’s Take
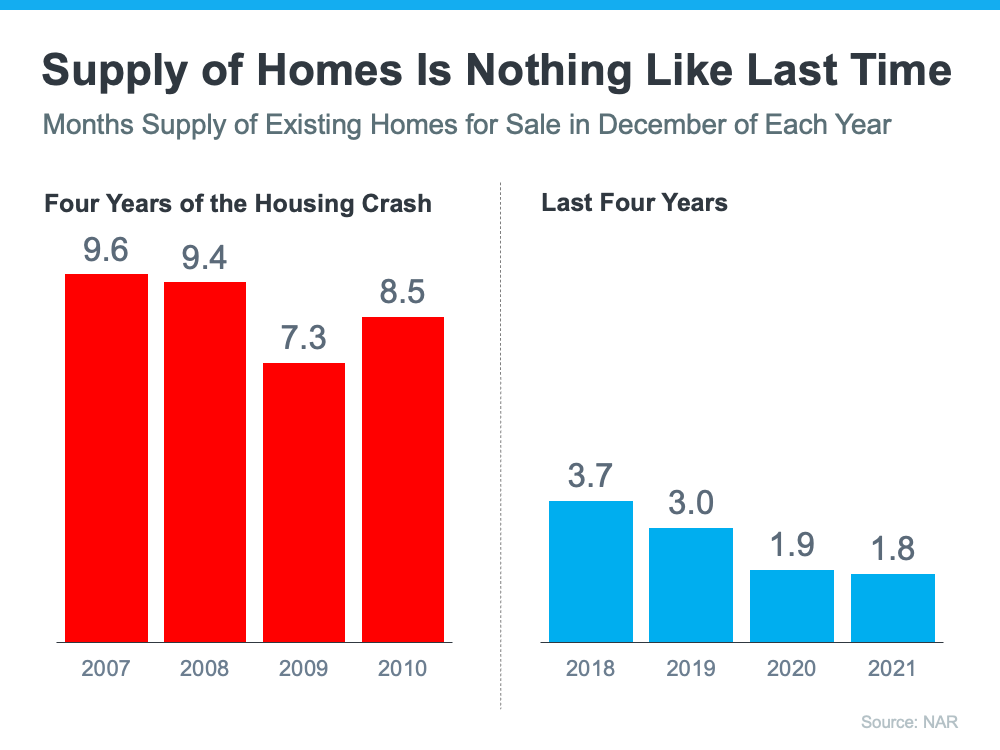
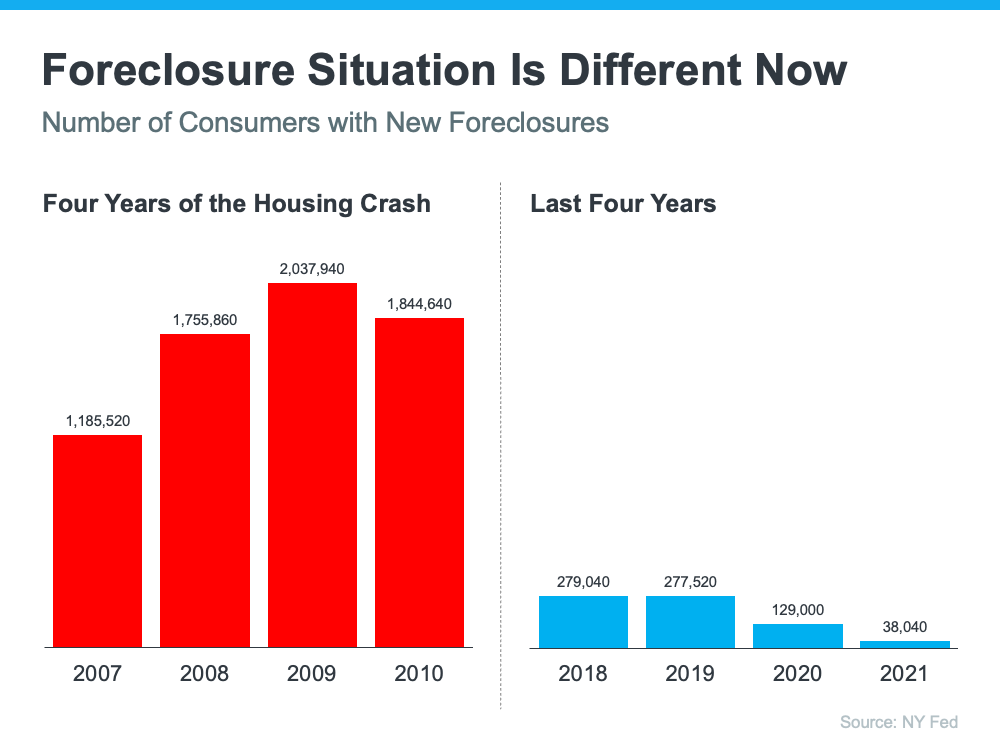
People still talk to me about “the bubble” and I keep explaining there isn’t one. Below are a couple of graphs to show why I continue to say that.
The supply of inventory needed to sustain a normal real estate market is approximately six months. Anything more than that is an overabundance and will causes prices to depreciate. Anything less than that is a shortage and will lead to continued price appreciation. As the next graph shows, there were too many homes for sale from 2007 to 2010 (many of which were short sales and foreclosures), and that caused prices to tumble. Today, there’s a shortage of inventory, which is causing the acceleration in home values to continue.

On the Outer Banks, there is a 1.3 month supply of homes, as of January 31st.
The most obvious difference is the number of homeowners that were facing foreclosure after the housing bubble burst. The Federal Reserve issues a report showing the number of consumers with a new foreclosure notice. Here are the numbers during the crash compared to today:

In our MLS the number of active distressed units on the market at any given time has been hovering around 6 for the past year.
There is just no comparison to “last time”. If you are looking for a deal remember; anything you buy today will be a deal two years from now.
No matter if you are buying or selling I am here to help you through the process. Contact me now and let’s get started.
Information in this article is based on information from the Outer Banks Association of REALTORS® MLS for the period January 23rd, 2022, through February 7th, 2022. Residential, not including co-ownerships.
